#E-commerce
#Figma
Dashboard for e-commerces
Dashboard for e-commerces
Dashboard for e-commerces
Dashboard for e-commerces
Dashboard for e-commerces
Dashboard for e-commerces
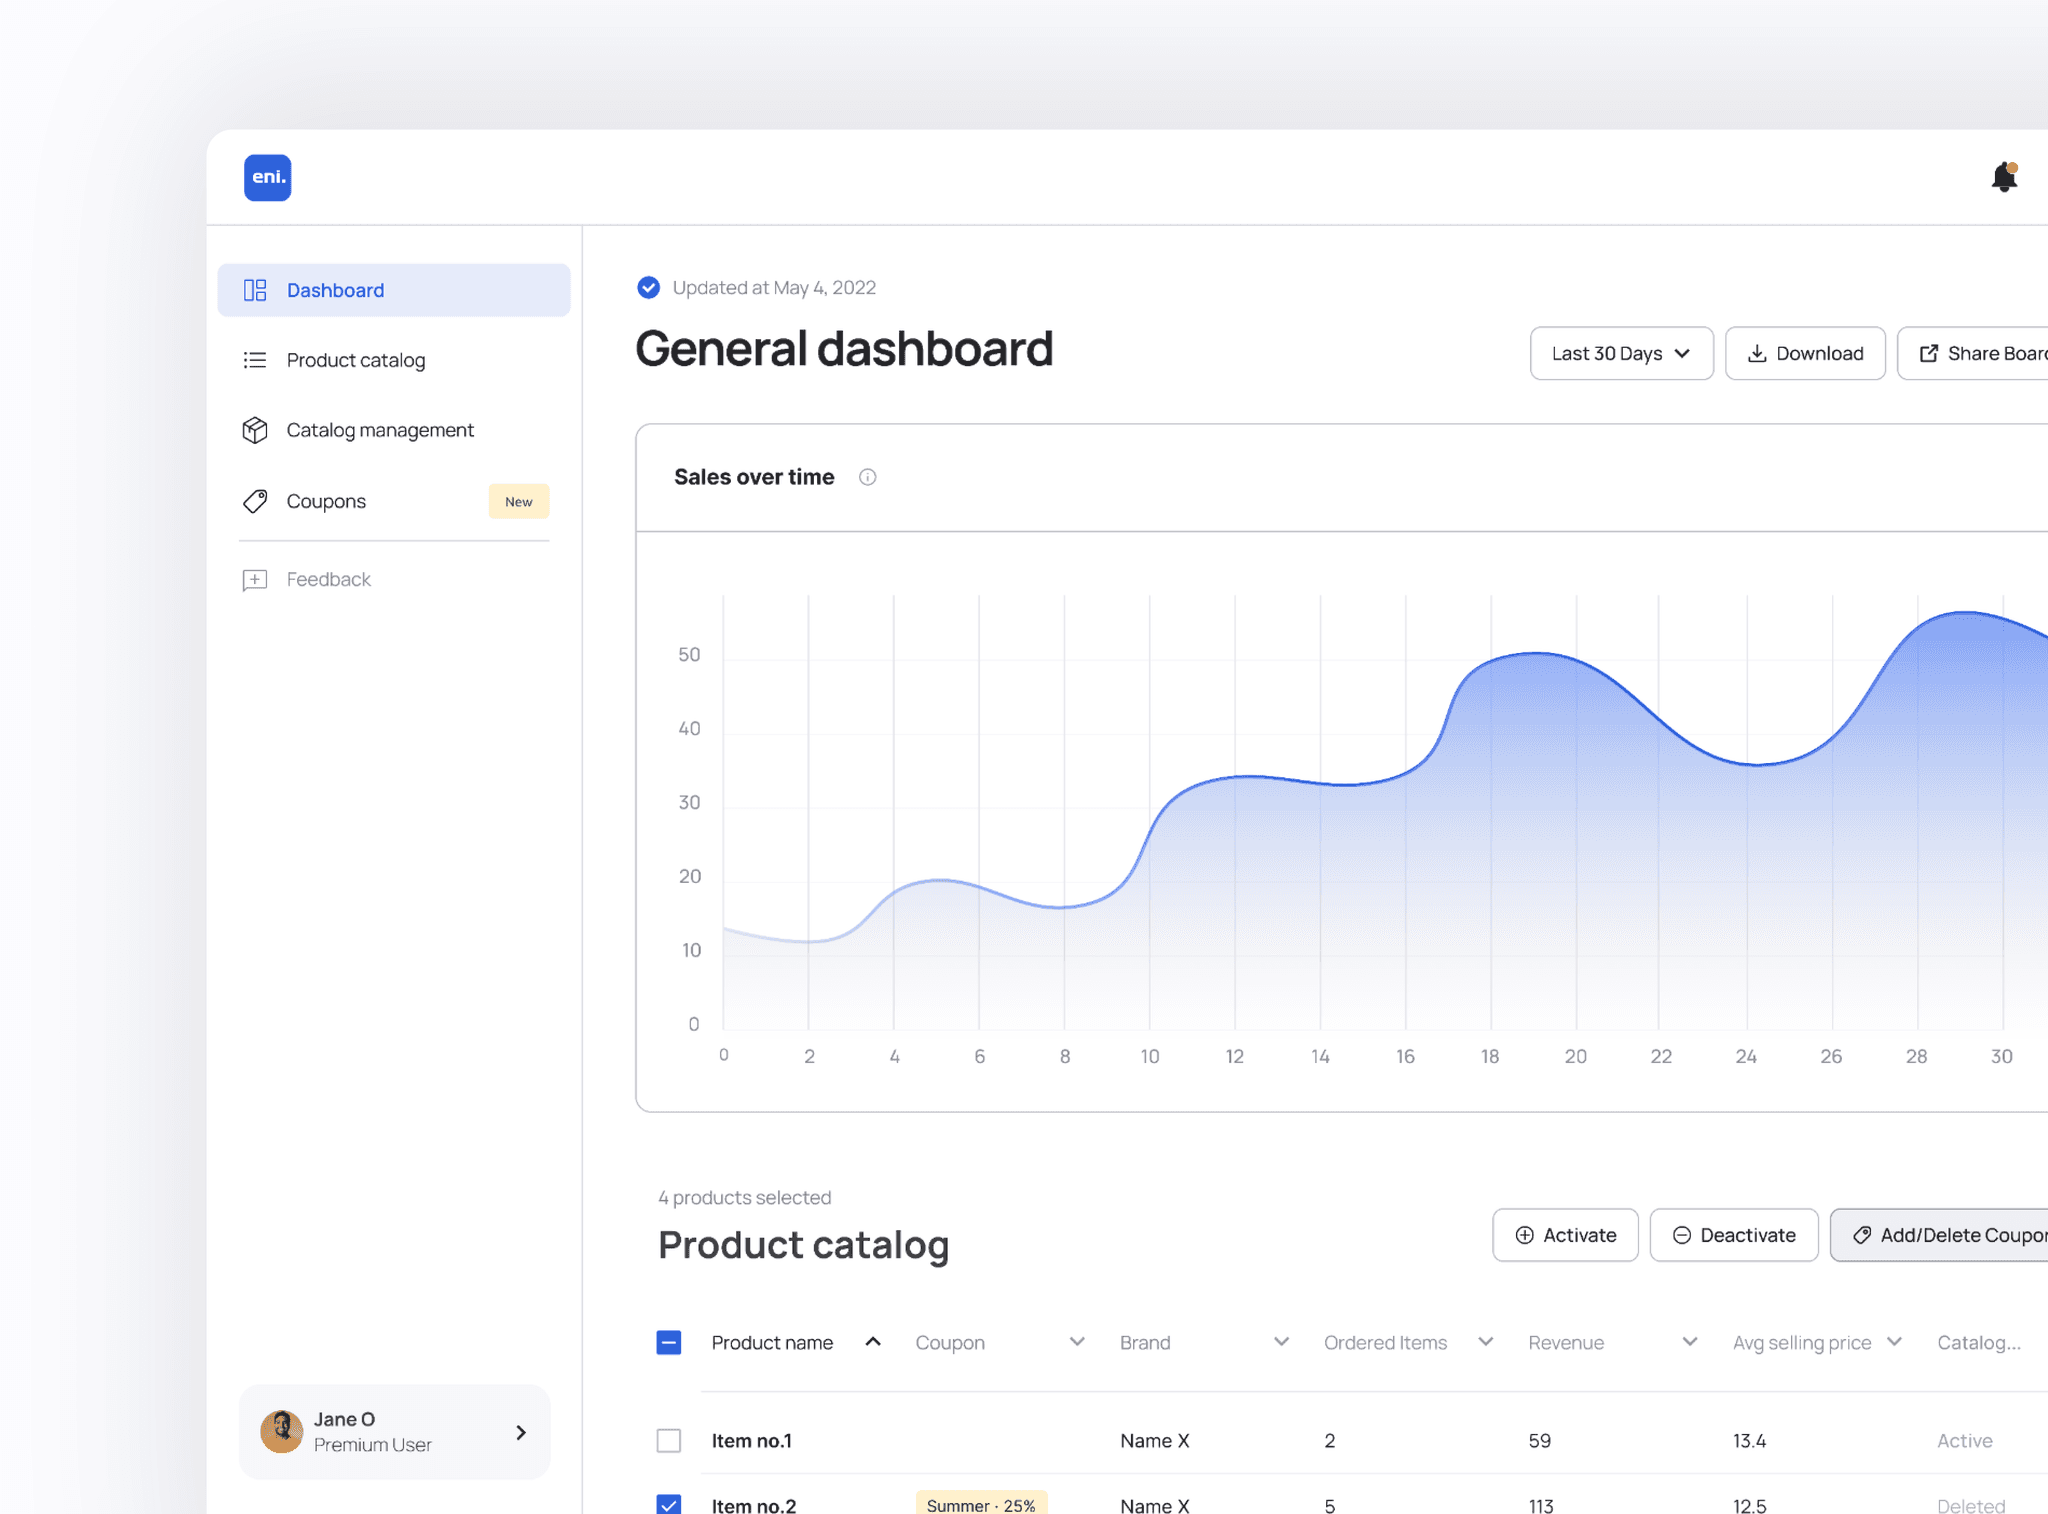
For this project, I designed a user-friendly and informative dashboard tailored for e-commerce owners. The goal was to give users a clear overview of their sales statistics and provide easy access to their product catalog.
For this project, I designed a user-friendly and informative dashboard tailored for e-commerce owners. The goal was to give users a clear overview of their sales statistics and provide easy access to their product catalog.
For this project, I designed a user-friendly and informative dashboard tailored for e-commerce owners. The goal was to give users a clear overview of their sales statistics and provide easy access to their product catalog.
For this project, I designed a user-friendly and informative dashboard tailored for e-commerce owners. The goal was to give users a clear overview of their sales statistics and provide easy access to their product catalog.
For this project, I designed a user-friendly and informative dashboard tailored for e-commerce owners. The goal was to give users a clear overview of their sales statistics and provide easy access to their product catalog.
For this project, I designed a user-friendly and informative dashboard tailored for e-commerce owners. The goal was to give users a clear overview of their sales statistics and provide easy access to their product catalog.


Digital Designer (UX/UI)
Role
Digital Designer (UX/UI)
Role
Background
Background
Our goal in this project was to design a dashboard that e-commerce owners find easy to use and informative. This dashboard needed to help them track sales performance and manage their product catalog effortlessly. We focused on presenting data clearly and making the design appealing to ensure users can make quick and informed decisions.
Our goal in this project was to design a dashboard that e-commerce owners find easy to use and informative. This dashboard needed to help them track sales performance and manage their product catalog effortlessly. We focused on presenting data clearly and making the design appealing to ensure users can make quick and informed decisions.
Goals
Goals
Display sales statistics clearly
The dashboard needed to show total sales figures for specific time periods prominently. It also had to break down sales by product category, giving users insights into their best-performing items. Graphs and charts were crucial for illustrating sales trends over time, making data easy to understand.
Integrate the product catalog seamlessly
Integrating the product catalog into the dashboard was essential. This integration allows users to browse and manage all their products conveniently from one place.
Integrate the product catalog seamlessly
Integrating the product catalog into the dashboard was essential. This integration allows users to browse and manage all their products conveniently from one place.
Integrate the product catalog seamlessly
Integrating the product catalog into the dashboard was essential. This integration allows users to browse and manage all their products conveniently from one place.
Integrate the product catalog seamlessly
Integrating the product catalog into the dashboard was essential. This integration allows users to browse and manage all their products conveniently from one place.
Integrate the product catalog seamlessly
Integrating the product catalog into the dashboard was essential. This integration allows users to browse and manage all their products conveniently from one place.
Ensure a user-friendly design
The dashboard's design aimed to be professional and modern. We focused on using a cohesive color scheme and clear fonts for easy readability. Visual elements were used to present sales data intuitively, making the dashboard functional and visually appealing.
Ensure a user-friendly design
The dashboard's design aimed to be professional and modern. We focused on using a cohesive color scheme and clear fonts for easy readability. Visual elements were used to present sales data intuitively, making the dashboard functional and visually appealing.
Ensure a user-friendly design
The dashboard's design aimed to be professional and modern. We focused on using a cohesive color scheme and clear fonts for easy readability. Visual elements were used to present sales data intuitively, making the dashboard functional and visually appealing.
Ensure a user-friendly design
The dashboard's design aimed to be professional and modern. We focused on using a cohesive color scheme and clear fonts for easy readability. Visual elements were used to present sales data intuitively, making the dashboard functional and visually appealing.
Ensure a user-friendly design
The dashboard's design aimed to be professional and modern. We focused on using a cohesive color scheme and clear fonts for easy readability. Visual elements were used to present sales data intuitively, making the dashboard functional and visually appealing.
Solutions
Solutions
Crafting clear sales statistics displays
We designed the dashboard to prominently display total sales figures and breakdowns by product category. Graphs and charts were included to show sales trends over time, ensuring users can quickly grasp important information.
Crafting clear sales statistics displays
We designed the dashboard to prominently display total sales figures and breakdowns by product category. Graphs and charts were included to show sales trends over time, ensuring users can quickly grasp important information.
Crafting clear sales statistics displays
We designed the dashboard to prominently display total sales figures and breakdowns by product category. Graphs and charts were included to show sales trends over time, ensuring users can quickly grasp important information.
Crafting clear sales statistics displays
We designed the dashboard to prominently display total sales figures and breakdowns by product category. Graphs and charts were included to show sales trends over time, ensuring users can quickly grasp important information.
Crafting clear sales statistics displays
We designed the dashboard to prominently display total sales figures and breakdowns by product category. Graphs and charts were included to show sales trends over time, ensuring users can quickly grasp important information.
Seamlessly integrating the product catalog
The dashboard was developed to integrate the entire product catalog seamlessly. This feature allows users to manage their products efficiently within the dashboard, streamlining their workflow.
Seamlessly integrating the product catalog
The dashboard was developed to integrate the entire product catalog seamlessly. This feature allows users to manage their products efficiently within the dashboard, streamlining their workflow.
Seamlessly integrating the product catalog
The dashboard was developed to integrate the entire product catalog seamlessly. This feature allows users to manage their products efficiently within the dashboard, streamlining their workflow.
Seamlessly integrating the product catalog
The dashboard was developed to integrate the entire product catalog seamlessly. This feature allows users to manage their products efficiently within the dashboard, streamlining their workflow.
Seamlessly integrating the product catalog
The dashboard was developed to integrate the entire product catalog seamlessly. This feature allows users to manage their products efficiently within the dashboard, streamlining their workflow.
Designing a user-friendly interface
Our focus was on creating a modern and professional design with a consistent color palette and easy-to-read typography. Visual elements were used to present sales data in an intuitive manner, enhancing both usability and visual appeal of the dashboard.
Designing a user-friendly interface
Our focus was on creating a modern and professional design with a consistent color palette and easy-to-read typography. Visual elements were used to present sales data in an intuitive manner, enhancing both usability and visual appeal of the dashboard.
Designing a user-friendly interface
Our focus was on creating a modern and professional design with a consistent color palette and easy-to-read typography. Visual elements were used to present sales data in an intuitive manner, enhancing both usability and visual appeal of the dashboard.
Designing a user-friendly interface
Our focus was on creating a modern and professional design with a consistent color palette and easy-to-read typography. Visual elements were used to present sales data in an intuitive manner, enhancing both usability and visual appeal of the dashboard.
Designing a user-friendly interface
Our focus was on creating a modern and professional design with a consistent color palette and easy-to-read typography. Visual elements were used to present sales data in an intuitive manner, enhancing both usability and visual appeal of the dashboard.
Tools
Tools
Figma
Jira

